Streamline your workflow with 5,000+ integrations including popular payment gateways, email, and marketing tools.






























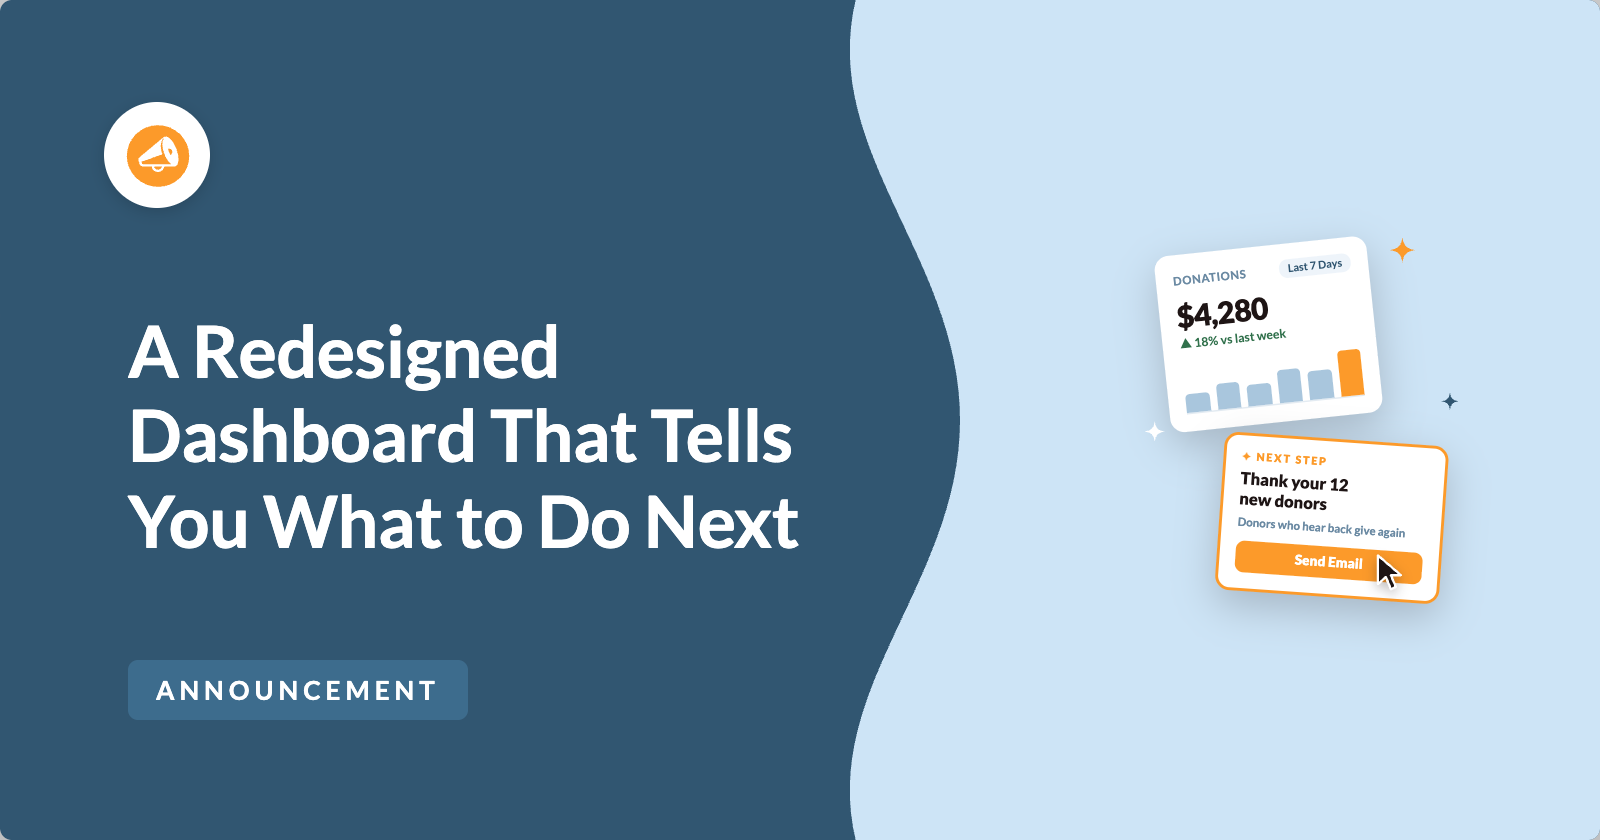
Most fundraising dashboards only tell you how much you have raised. Charitable Pro 1.8.19 rebuilds the dashboard and the Reports Overview around the harder questions: whether anything is broken, whether this period beat the last one, and which single change would make the most difference today. Why this is important:
- 📈 Every figure has a trend: Pick a period and the tiles and the chart move together, with each total shown against the previous period.
- 🗓️ Charts that stay readable: Short ranges group donations day by day, while longer ranges group by week or month, so a full year reads as a curve instead of a flat line.
- 🔀 Compare any 2 periods: Not just consecutive ones, so you can ask how this December did against last December. That matters because fundraising is seasonal.
- 📤 Export the whole summary: Send the full overview out as CSV or PDF, ready for a board pack or a funder report.
- 🎯 Score your setup for free: Have your fundraising setup scored, so the one change worth making next is the one you can see.