













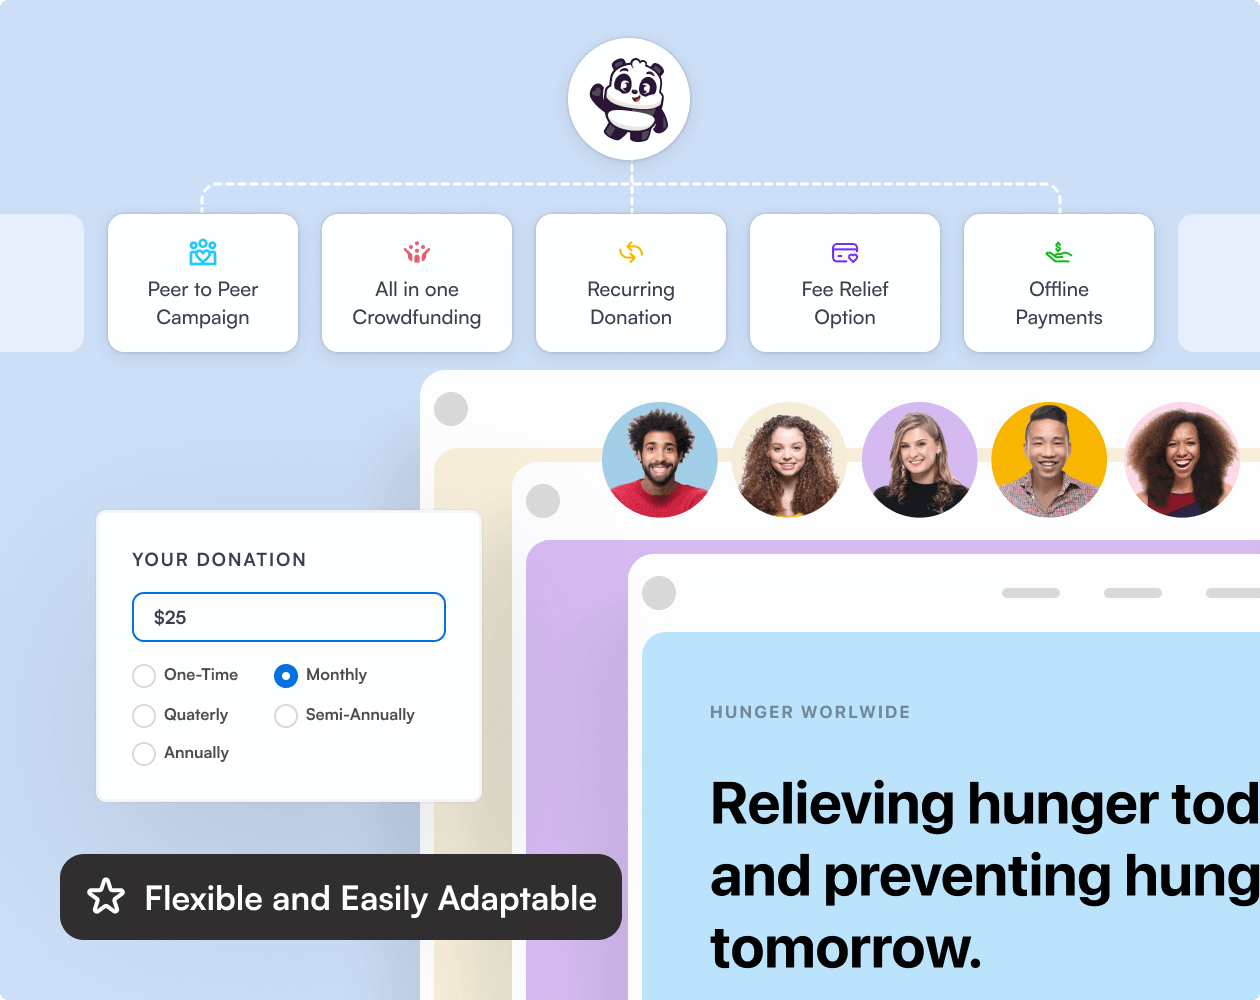







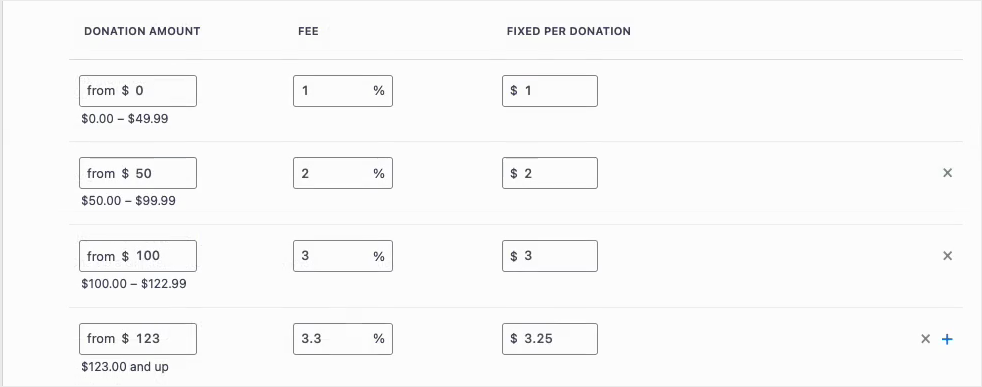
Fee Relief asks your donors one short question at checkout: would you like to cover the processing fee on this gift? Until now that question used a single rate for every donation on a gateway, so a $10 gift and a $500 gift were asked for the same percentage. Fee Relief 1.3.0 lets you set as many donation bands as you like, each carrying its own rate. Why this is important:
- 🪙 Gentler on small gifts: A fixed transaction cost is a far bigger share of a $10 donation than a $500 one, so bands let you ask for less at the bottom.
- 🎚️ As many bands as you need: Each band carries its own percentage and its own fixed amount, and the top band runs on with no upper limit.
- 🛑 An optional ceiling: A Maximum fee field stops any donor being asked for more than a number you choose, however large the gift.
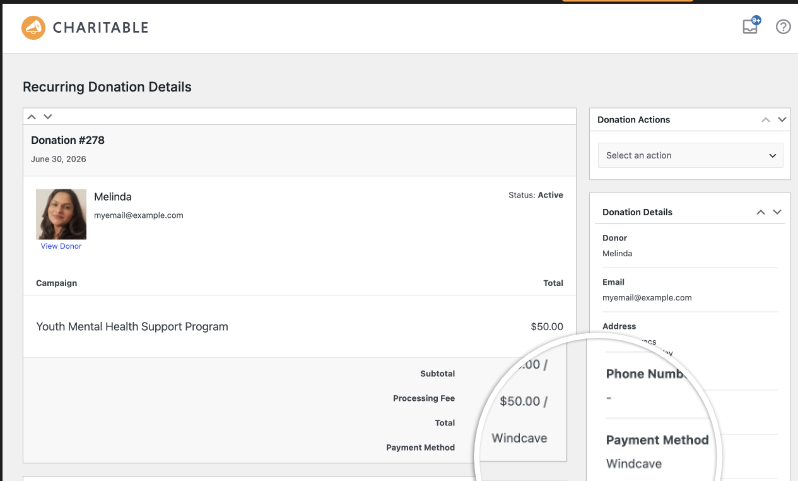
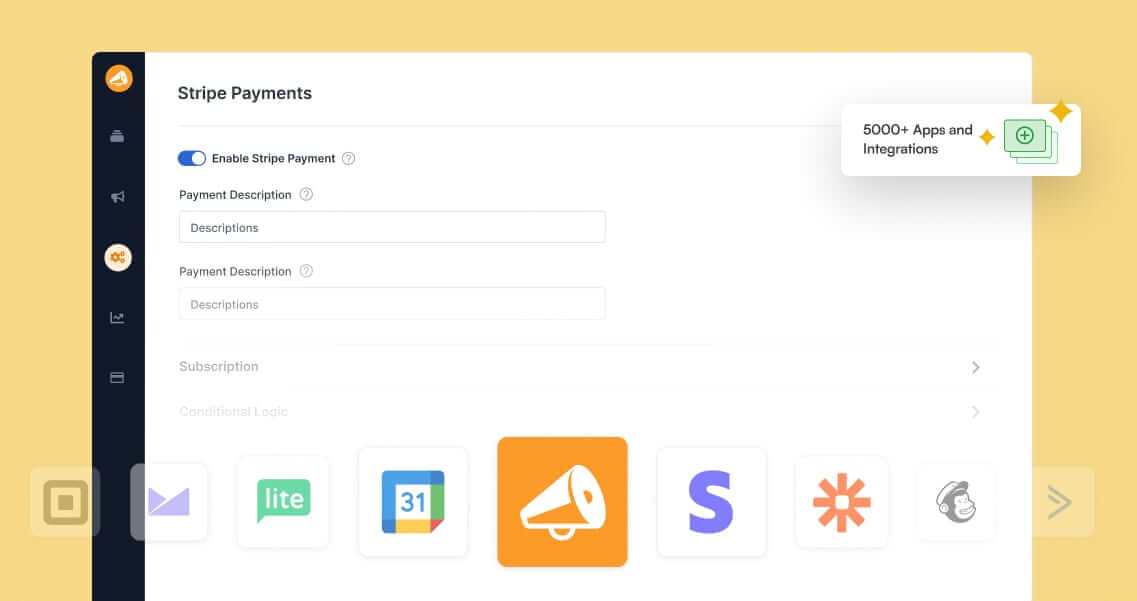
- 🔌 Set per payment gateway: Stripe can run on four bands while Windcave and Payfast stay on a single rate, because bands belong to a gateway and not to your whole site.
- 🛡️ Nothing changes until you say so: Your current rates stay exactly as they are until you switch Use Tiered Rates on under
Charitable » Settings » Advanced » Fee Relief.