Do you want to see all your fundraising figures for one campaign or one date range? The Reports Overview brings your donations, donors, campaigns and payment methods together in a single report.
This guide covers filtering the report, reading the 4 tiles, and what each section of the report shows you.
With everything in one place, you’ll be able to answer most questions about your fundraising without building a spreadsheet.
The redesigned Reports Overview is available in version 1.8.19 of the Charitable Pro plugin.
What’s In This Guide?
Where to Find the Reports Overview
To open the report, go to Charitable » Reports. You’ll land on the Overview tab.
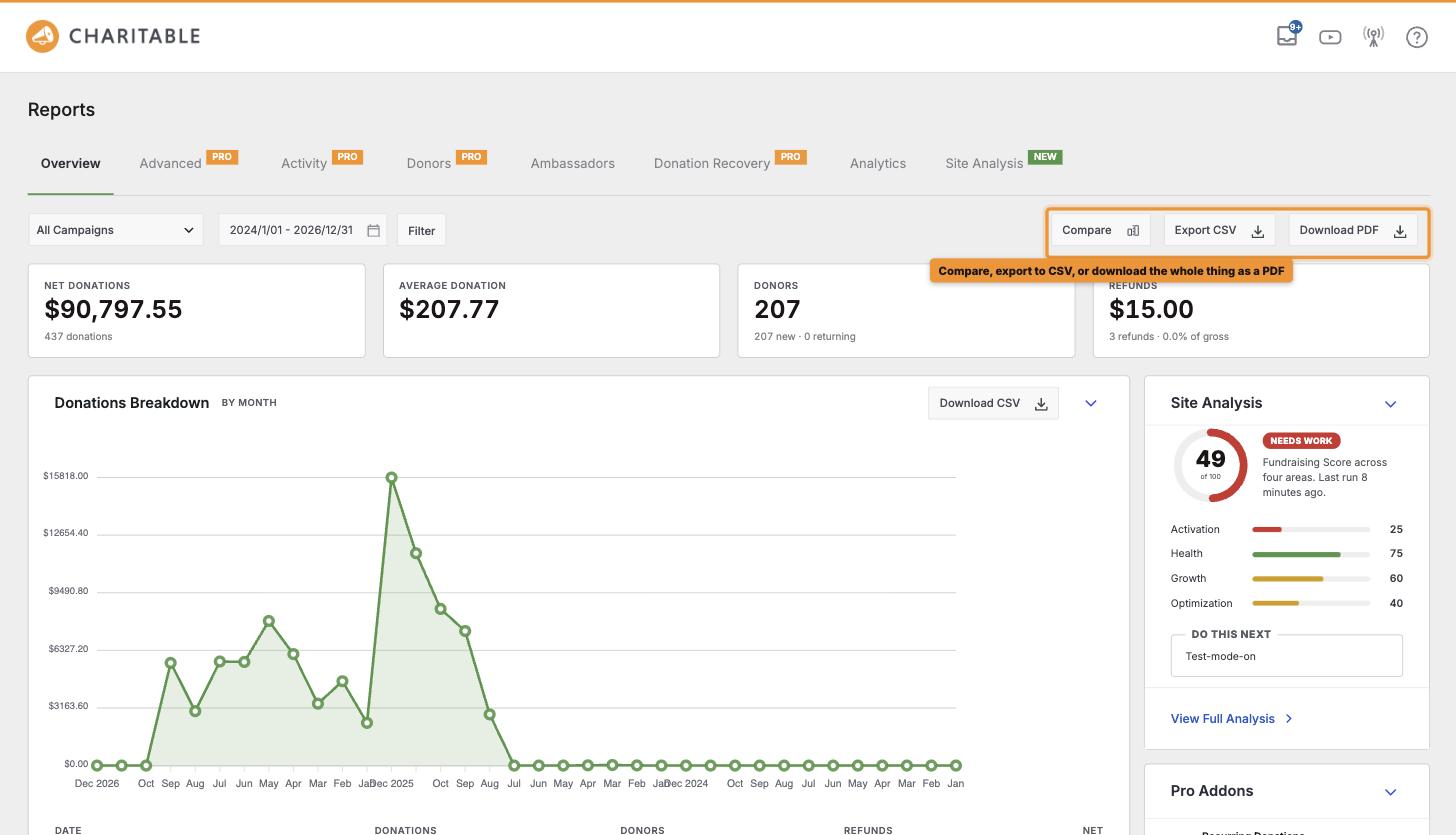
The other tabs along the top, such as Activity, Donors and Site Analysis, each open a more detailed report on that one area.
The first time you open the Reports Overview after updating, you’ll be offered a short guided tour. You can take it or dismiss it, and you won’t see it again either way.
Filtering the Report
To choose what the report covers, follow these steps.
- Pick a campaign from the first dropdown, or leave it on “All Campaigns”.
- Pick a campaign category from the second dropdown, or leave it on “All Categories”.
- Set the start and end dates in the date field.
- When you’re ready, click “Filter”.
Every tile and section on the page updates to match. The “Compare”, “Export CSV” and “Download PDF” buttons on the right have their own guides, linked at the end of this one.
Reading the Tiles
Below the filters, you’ll see 4 tiles.
- Net Donations is the amount raised after refunds, with the number of donations underneath.
- Average Donation is the average size of a gift.
- Donors is the number of people who gave, split into new and returning donors.
- Refunds is the amount refunded, with the number of refunds and their share of the total.
Under each tile, you’ll also see the period it’s being compared with, such as the week before.
The Main Report
The report is laid out in 2 columns. The wide column on the left holds the main sections.
- Donations Breakdown shows a chart and a table of your donations, grouped by day, week or month to match your date range.
- Activity shows recent activity across your campaigns. Click “View All Activity” to open the full Activity report.
- Top Donors shows who gave the most in the period.
- Top Campaigns shows how each campaign is pacing against its goal and end date, so you can see which ones are falling behind.
- Donation Recovery shows what abandoned donations are costing you and how much has been recovered.
Note: If Donation Recovery isn’t turned on yet, you’ll see a preview with an “Activate Donation Recovery” button instead of your own figures.
The Summary Rail
The narrow column on the right is the summary rail. Each card can be closed with the arrow in its top corner.
- Nonprofit Site Analysis shows your fundraising score, your score in each area and a Do This Next suggestion. If you haven’t run it yet, you’ll see a “Run Your Free Analysis” button.
- Pro Addons lists the Charitable addons on your site.
- Payment Methods shows how much each payment gateway brought in, as an amount and a percentage.
- Donation Sources shows where your donors came from, based on the page each donor first landed on.
- Email This Report sends this overview to your team every week.
Note: Donation Sources only counts donations made after tracking started on your site, so older donations won’t show a source.
Tips Worth Keeping in Mind
A few habits that help you get more from your reports.
- Filter by a single campaign before a campaign review meeting, so every figure on the page is about that campaign.
- Check Top Campaigns halfway through a campaign, while there’s still time to catch up.
- Look at Payment Methods before you remove a gateway, to see how many of your donors use it.
FAQs on the Reports Overview
Why does a section say there are no donations in this date range?
No donations match your current filters. Try a wider date range, or set the campaign back to “All Campaigns”.
Does the report include refunded donations?
Net Donations is the total after refunds. You’ll see the refunds themselves on the Refunds tile.
Can I share this report with my board?
Yes. You can download it as a PDF, export it as a CSV, or email it to your team every week.
Wrapping Up
You now know how to filter the Reports Overview, read its tiles, and find your way around the main report and the summary rail.
Next, you can compare 2 periods or share the report with your team. If you get stuck on any step, our support team is happy to help.
You May Also Want to Read
These guides cover the tools at the top of the Reports Overview.
- How to Compare Fundraising Between 2 Periods. Use the Compare button to see this year against last year.
- How to Export Your Donation Reports as a PDF or CSV. Download the report for a board meeting or your finance team.
- How to Email a Weekly Fundraising Summary to Your Team. Turn on the Email This Report card.
- Charitable Donation Recovery. Set up the feature behind the Donation Recovery section.
Helpful Links
🤝 Get help when you need it
Connect with Customer Support →
📑 Find the guide you need
Browse the Documentation Hub →
⬇️ Download proven strategies, campaign ideas, and expert tools
🔗 Let your AI Assistant do the fundraising work for you.
Connect Charitable to your AI assistant →
💸 Get Free Fundraising Resources
Head to the Charitable Fundraising Hub →
🤔 Got questions about Charitable?
Charitable FAQs →
Need help understanding non-profit terms and jargon?
See our Non-Profit Glossary →

Charitable Now Works With the AI Assistant You Already Use
This is the most fun thing we’ve shipped all year, and you have to try it. You can now use ChatGPT, Claude, or any AI assistant you’re already using to build and launch fundraiser campaigns.
You can create donation records, manage donor profiles, fetch data, and get fundraising reports too. Simply connect your AI agent, and start asking for what you want.
No Charitable addon needed, no coding, and no elaborate setup. Anyone can do it!